SEO reporting and tool stacks for publishers
Breaking down the tooling and analytics stack you should consider as an SEO in the publishing space
Hundreds of articles a day. Freelancers with no formal training on how to use the company CMS or digital production standards. Departments using different metrics to make decisions. No wonder reporting is a fucking nightmare.
Pick your poison and go down with the ship. Metaphorically of course.
TL;DR
Your business goals should define your reporting. As an SEO, your reports should still be ‘revenue’ first.
Make sure your report(s) have a clear and concise summary slide where you can immediately identify any issues
Automate everything (or as much as you can). Save your brainpower for the analysis
Build what you can in-house, but don’t be afraid to get external help
Where do I start?
You need a plan that delivers maximum value with minimum effort. The creme de la creme of all plans. Establish what is useful for the SEO team to know and what you need to share with the business (remembering they will likely lose interest after three slides) and automate everything.
Well, everything possible. When creating reporting plans and tool stacks, start with an outcome. A business need. Document everything and work backwards from there.
What do I need to track?
This does depend on your status as a publisher. Behemoths like the BBC, The Guardian and The Telegraph (ahem) will have very different demands than niche, single-topic publishers.
Broadly you need to track the following;
Search traffic
Search conversions - as a paywalled site, our conversions are fairly binary
Traffic split by channel (inc. Google Discover)
Backlinks (honestly we don’t but you probably should)
Competitor performance
Evergreen and news performance
Explainer performance (tagging your articles as explainers is probably the most effective way to do this)
Traditional search traffic and conversion data
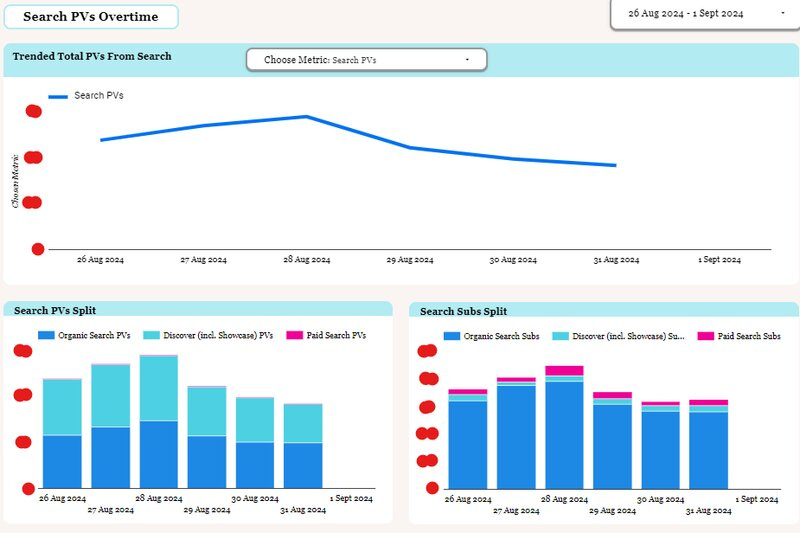
I think you can track traditional search traffic by integrating data from Google Search Console and Google or Adobe Analytics into a single Looker report - some kind of SEO performance dashboard.
Here I would integrate conversion data and make sure there’s an exec-level summary slide that allows you to see the following;
MoM conversion and traffic data
YoY conversion and traffic data
Total search traffic
Traffic and subs split by channel
A performance breakdown of your most valuable areas of content
These reports should provide an immediate performance overview and allow you to break things down in greater detail if required. You need to be able to spot significant changes quickly. Make sure the report isn’t built for analysts.
Google Discover
Tracking Google Discover can and should be built into any SEO Performance dashboard. You want to see a traffic split and a breakdown of the types of articles that are and aren’t successful.
Whilst Search Console’s Discover analysis tab is fairly limited, there are other options like Marfeel and Discover Snoop. Both can be immensely valuable, but arguably primarily for big publishers.

Lily Ray’s excellent guide to Google Discover is a great place to start for those looking to optimise and improve their Discover performance.
Whilst Marfeel is more of a content intelligence tool, it has recently launched a real-time, location specific Discover monitoring tool. We’ve been playing around with it recently and have been impressed.
Backlinks
As a large publisher, we aren’t overly worried about tracking backlinks. We generate thousands each day and ranking for most things is achievable. The only time we make more of an effort here is when;
We have some campaign-worthy content
We’re launching a new ‘product’
Or we’re launching in a new location
But my recommendation for most sites would be to use ahrefs (still the biggest backlink database around) and leverage Looker Studio’s data visualisation capabilities to build an automated report.
Personally, I think the best way of checking a quality link is to track both the referral traffic you get from each link and the traffic the page and domain that link to you receive. Metrics like DA or PA are more on the vanity side. This Looker Studio template from Ivan Palii does a great job of tracking referral traffic from backlinks.
Top Stories
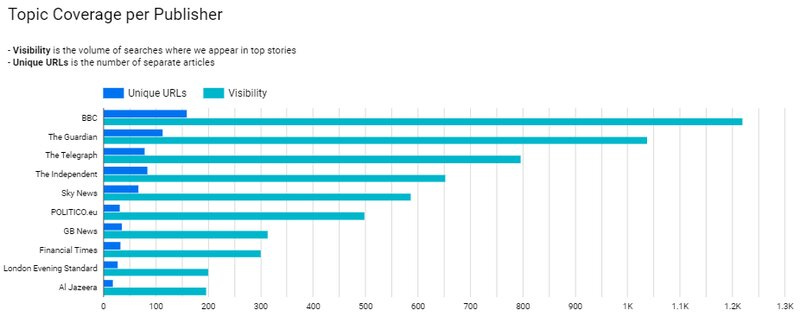
A true obsession for every big news publisher and whilst you can’t track direct Top Stories performance through Search Console, you can track how effectively you and your competitors rank through either a third-party tool or a a custom script, keywords, a way of storing the data and a method of visualising the data. More on that later.
Evergreen content performance
It’s very tricky to truly distinguish between news and evergreen content performance for big publishers. The best advice I can give is to identify your most important evergreen content and tag it to make reporting on the top x number of pages simple and effective.
If you’re fortunate enough to have evergreen content split out by subfolder (then I envy you immensely), then you can create subfolder-specific properties in Search Console and visualise that data in Looker Studio.
Setting up your SEO teams effectively is crucial when it comes to ownership, reporting and analysis. If you’re a big news publisher, there’s a good chance you have a separate evergreen team. IMO, this is the right way to go.
We are currently working on a tool to identify dropoffs in evergreen content so that we can clearly define when pages need to be updated. It’s all about making your life easy.
Competitor publishing
This is a more challenging project and there are two ways of doing it. One is to build a custom tool that scrapes and visualises data from a Google News Sitemap. This is more effective for larger publishers. The other is to pull data manually from tools like ahrefs or SEMRush.
Site speed
The key to site speed is to continuously work on it without it ever being a priority project. Once you’ve reached an acceptable standard I mean. While Lighthouse reports are useful for evaluating issues and Search Console gives some good guidance around the types of pages and Core Web Vitals to work on, you need real world data.
If you’re a bigger publisher who has a significant number of page templates and large dev teams. Tools like Speed Curve are invaluable in these scenarios. If you’re a smaller publisher, Search Console, Lighthouse and a tool like GT Metrix or Pingdom that has a Waterfall chart should be sufficient.
Typically we will add a subset of pages and page templates to measure and evaluate RUM data each month. The pages we add are based on relevant tech team projects. Google has very recently released a truly excellent site speed tracker based on RUM data called CRUX VIS which gives you access to real world competitor data.
Typically we will add a subset of pages and page templates to measure and evaluate RUM data each month. The pages we add are based on relevant tech team projects.
Number of pages crawled and indexed
The ‘pages’ report in Search Console gives a pretty good overview of how Google views your site. Which pages have been crawled by Google but not indexed can be a treasure trove of information. These may or may not be indexed in the future, but if you see patterns in the page type or URL then it is absolutely worth investigating.
You can find out more about what each of these terms means in Google’s page indexing report.
What free tools should I use?
The free tools I use are designed to save time, make analysing content at scale easier and automate the analysis of data at scale.
Free SEO tools for publishers
Google Trends - an essential for news SEO
Google Analytics
Search Console
Looker Studio - visualise and automate everything. That’s my advice
Perplexity AI - found this very useful for keyword research recently
Chat GPT - of course
GT Metrix/Pingdom - not strictly free, but very good free versions
BrowSEO - see the web like an engine does
SERPerator - simulate browsing from multiple locations
Panguin Tool - lays a timeline of algorithm updates over your traffic data to spy any correlation
Chrome extensions for publishers
There are some fantastic Chrome extensions for publishers that speed up good SEO’ing and cost nothing. Some of my favourites are;
Glimpse - a fantastic Google Trends plugin
Redirect path - trace redirect
Detailed SEO extension - SEO overview
Lighthouse - speed, security, etc
SEO schema visualiser - visualise connections in JSON-LD markup
Toggle Javascript - toggle JS on and off on a page
What should I buy?
I’ve never been one for relying on tools but I think there are some essentials you should have in your arsenal, including;
One of the big SEO tools; ahrefs, SEMRush, you know the ones. I have no personal preference and think they’re very useful, but expensive. And now have the customer experience of a budget airline without the social media gags.
API and data collection for SERP and rank tracking, backlinks, keyword tracking, and customisable visualisations are only possible based on data connectors like this. Data for SEO is more reasonably priced than SERP API. Arguably only necessary for larger publishers or those looking to build their own tools.
Site speed monitoring tool: If you have the budget and desire, get some RUM data. You can use a combination of Lighthouse, Search Console and cheaper options like GT Metrix or Pingdom if you know what you’re doing.
A website crawler (Screaming Frog for most websites, a cloud-based crawler for huge sites). Preferably one where you can set up custom scheduled crawls to compare results before and after. Options like Lumar are very expensive, but can help support the tech team with automated checks post releases at scale.
A keyword tracking tool like GetSTAT or Pi Datametrics if you’re a big publisher. Using pre-existing tools like ahrefs and SEMRush if you already have them and want to save money is fine. The keyword tracking isn’t as good, but it will do the job.
What should we try and build in-house?
Some tools track competitors’ and Top Stories’ performance. NewzDash springs to mind as the one most commonly used in the publishing industry. But these tools tend to come with a lot of fat you do pay over the odds for.
For example, you can build a Top Stories tracker in-house with a combination of Data for SEO, a Python script designed to scrape the Top Stories box at a keyword level (running at 5-15 minute intervals, a way of storing the data (BigQuery the most accessible and widely used) and a Looker studio dashboard to visualise the data.

All of the above should cost a couple of hundred pounds a month based on a couple of hundred hand-picked keywords being tracked throughout the day. This is 10-20 times cheaper than some of the big tools out there. And far more customisable.
You can create a similar tool by scraping competitors Google News sitemaps. By visualising and categorising the data, you can track how much your competitors publish over time, what their hourly and daily publishing schedule looks like and when their event coverage begins.
Ultimately it completely depends on your budget and requirements. Building tools can be exciting, but can also be a real drain time-wise. So be sure whatever you make you and your team will use them.
What really moves the needle in SEO?
TL;DR There is no one-size-fits-all approach to SEO. Make sure you plug into the company’s goals before prioritising them
Now what?
Now you need to create a weekly or monthly report that is three things;
Clear and concise
Actionable
Easy to update and automate
Everything you’ve built above should add value. But it won't be used across the company unless you pull this information together into a digestible format. Once you’ve set things up, you need to share it. Don’t waffle.
Open people’s eyes and ears to the value you can add. Publisher websites are vast and need a team to digest information and tell them what to do. Lead, make sure what you suggest adds value.


